

Very Telling Map of 2016
Everyone knows the pundits of the 2016 Election were caught off guard by the victory of now President Trump. The New York Times has now published an interactive map to show each precinct across the county and how they voted in the Presidential Election.
It's no secret that urban areas went for Hillary, we know that the night of the election. What does that mean? Well, it would take a lot of study to come to the true answer to that question. I'll let you come up with your own conclusions.
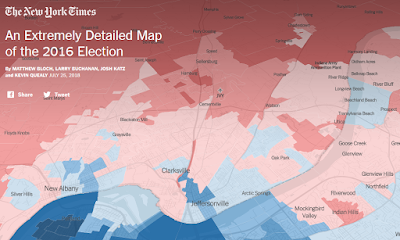
(Click the picture to view the map)
The real question is, will the R's be able to hold this footprint in November or will the D's find a way to spread their blue over the region?
To answer that, we will have to wait until November! In the mean time, I will be putting the SIOM predictions out soon. Stay Tuned!
Do you have the scoop?
What are your thoughts?
Let us know in the comments below!
No comments:
Post a Comment